
Grafana Loki | Resource Guide
My go-to guide for deploying Grafana Loki. This post is regularly updated with Loki notes and deployment setups


This acts more of a bookmark or reference article for use when deploying Loki. Forgive my poor writing. Polished w/ Grammarly
Grafana Loki is an open-source log aggregation system inspired by Prometheus. Named for the trickster god in Norse mythology, Loki, like its namesake, stands as a revolutionary system that disrupts traditional log aggregation systems. Like Prometheus, Loki follows a similar design philosophy, focusing on minimalistic design and cost-effective performance.
tl;dr
Deploy Loki with Docker with the best settings, mine :)
Embedded JavaScript
Useful Loki Links
 Grafana Labs
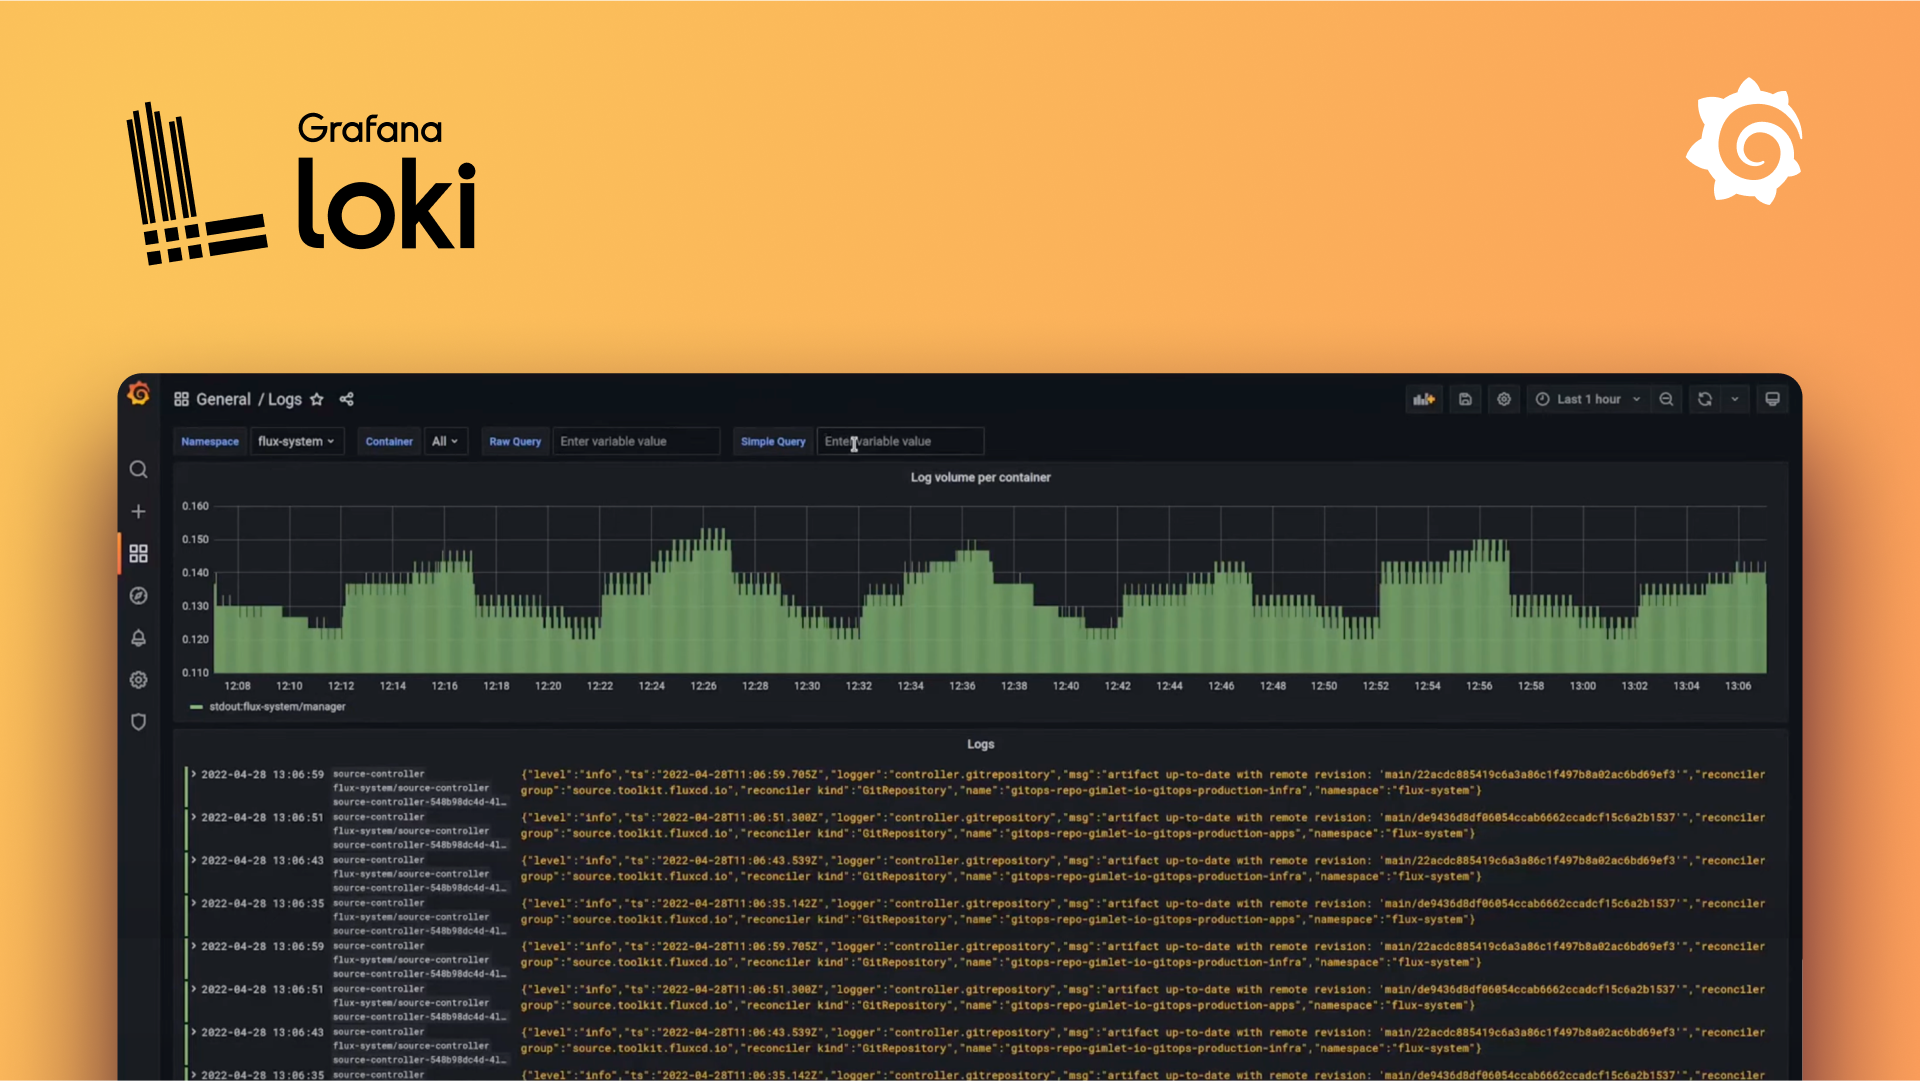
 GitHubGrafana Labs
When Do I Need Loki?
Loki comes in handy in a variety of scenarios. Its utility lies in its ingenious yet simplistic design that uses indexes to determine the location of logs but doesn't read the log content. This approach drastically reduces costs and paves the way for smoother scalability.
Loki is a perfect fit for any organization that deals with a substantial volume of logs and is struggling under the weight of indexing costs associated with traditional systems. It empowers developers with the ability to search for logs without needing to index unnecessary data, providing a highly efficient and cost-effective logging solution.
Additionally, with its seamless integration with Grafana, Loki provides meaningful context to the logs through impressive data visualization. This makes it an excellent choice for users who are already familiar with or existing Grafana users. Honestly, you should be using Grafana...
How Do I Deploy Loki?
Deploying Grafana Loki is a breeze. It can be done in multiple ways, reflecting the software’s versatility. I like whales, so we Im discussing whales here...
Grafana Labs
The Config File
As with most services, Docker Env Vars are great, but not for complex configs. Use the `loki.conf` instead of Docker Vars, you'll thank me later...
Embedded JavaScript
Promtail?
Yes, you will need this. I'll link that article here when it is complete.
Docker Compose Settings
The docker compose is at the top of this article, for obvious reasons, but I've broken down the various settings I used below.
| Setting | My Choice | Options | Notes |
|---|---|---|---|
| container-name | loki | whatever | The name of the container |
| hostname | loki | whatever | Name of container on network |
| ports | 3100:3100 | whatever | the port Exposed:Mounted |
| networks | analytics | I'll explain later | You'll thank me for this |
| restart | unless-stopped | never,always,on-failure | Use my choice |
Closing Notes
To sum up, Grafana Loki is an innovative, cost-efficient log aggregation system providing scalable solutions for users. It’s robust, open-source, and integrates seamlessly with Grafana, making it an irreplaceable tool in the arsenal of developers and data analysts.
The open-source revolution has led to the creation of many such innovative solutions, and Grafana Loki showcases the potential of simple, effective designs that address real-world challenges and constraints in the field of data analysis. Whether you're a developer looking for efficient log management and analytics tools or a data analyst intended to glean meaningful insights from mountains of log data, Grafana Loki is one tool you definitely shouldn't overlook. The future of log aggregation is here, and it goes by the name Loki.
This post is intended to provide a preliminary introduction to Grafana Loki. Don't be dumb. sudo chmod -R 777 Stay spicy